
How To Read The Thinkorswim Options Chain
The Thinkorswim platform can be a bit intimidating and hard to navigate especially if the only other platform you have known is something like Robinhood or one of those plain vanilla tools.
But Thinkorswim is like a Swiss army knife of trading and is really a powerful platform once you learn your way around it. In this little guide I am going to show you how to find the Options Chain in TOS and then I will show you how to read the Options Chain. Just click on the images to expand them.
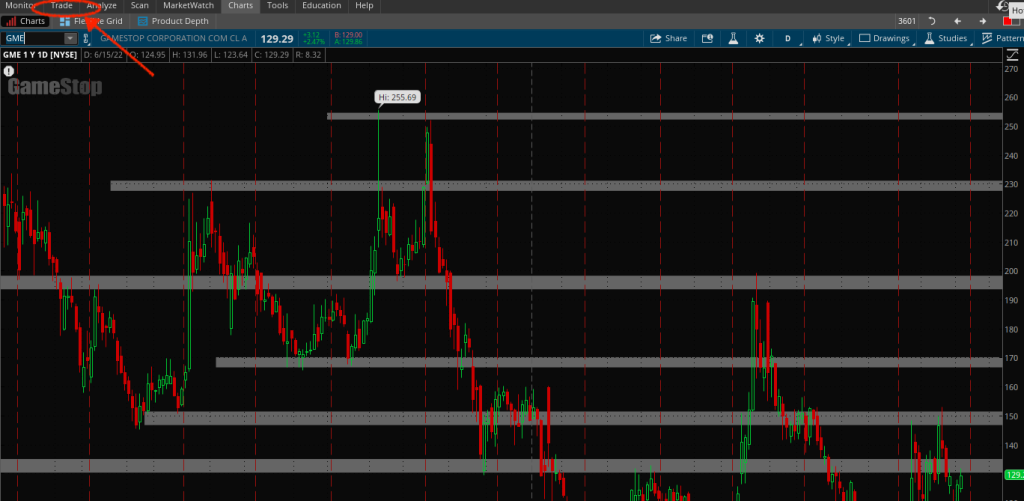
Step 1: Pull up the chart of the stock or ETF that you are looking at & Click on the “Trade” tab in the upper left hand corner
Reading The Options Chain
Now you have found the chain now let’s take a quick and basic read of the info on the chain.
The first thing you will notice is that the chain is split in two. On the left side are the Calls & on the left are the Puts. In the middle are the Strike prices. This can all be customized to set up your chain however you want. As I said, TOS is powerful.
Now let’s dig in further, You will notice that the tabs on the chain are labeled 1,2,3 etc. But before I go through these and tell you what they are, you should know that these are all customizable. You get to choose the data points that you want on your Option chain.
All you need to do is click on the tab that says “Layout” and then select “ customize” from the dropdown menu.
You will see some preset /suggested data points right at the top but you can select the data points you want in the left column and add them to the right side and to your layout.
Now let’s take a look at what all these data points mean and how you should use them. I am going to number each data point and then state its name and definition.
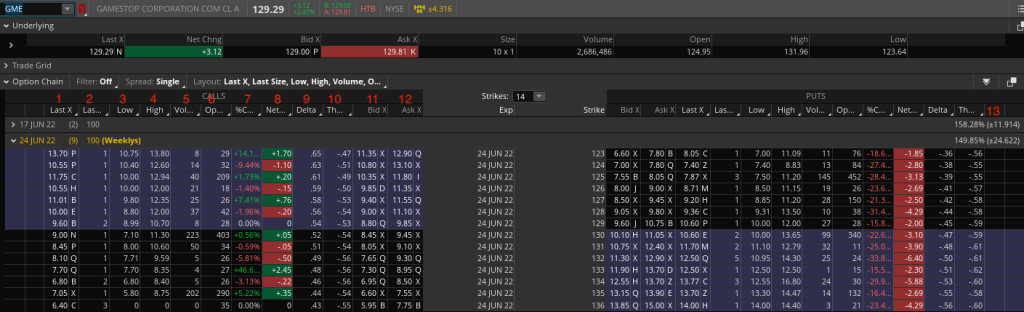
1. Last Price: This is the last price at which the Option contract was traded
2. Last Size: The last price at which the contracts were traded
3. Low: The lowest price at which the contract was traded
4. High: The highest price at which the contract was traded
5. Volume: The number of contracts traded during the session
6. Open Interest: The number of contracts that are currently held by traders
7. %Change: The % increase or decrease in the option contract
8. Net Change: The $ change in the price of the contract
9. Delta: This number tells you how much the option price should go up or down with every $1 move in the underlying stock.
10.Theta: This number represents the time decay. It will tell you the rate of decline of the option value over time.
11.Bid: The current price that traders want to pay for the contract
12.Ask: The current price that traders want to sell the contract at
13.This number is the Implied Volatility + the Expected move. You will notice that the Expected move number has a + & – sign in front of it. This basically saying that the expected move for that expiration is either +2.76 or -2.76.
Now lets take a look at the other data points
14. Intrinsic Value: this is the amount by which the option contract is in the money
15. Extrinsic Value: this is the amount by which the option contract is out of the money
16. Prob. ITM: This is telling you what the probability is of the stock being in the money by expiration
17. Prob. OTM: This is telling you what the probability is of the stock being out of the money by expiration
18. Prob. Touch: This is telling you what the probability is that the stock will be at the money or touch the strike by expiration.
This is not an exhaustive list by any means but these are the most important metrics/data points that you will probably need to handle yourself in the Options market. I hope it helps.
If you want to get a real profitable edge in your Options trading you should check out this excellent guide on Unusual Options Activity and the Unusual Options Activity Scanner.
Happy Trading