How To Find The Options Chain
Just pull up the stock chart and click on the “Trade” tab in the upper left corner. If you are on a mobile device then you can click here to see how to open the Thinkorswim Option Chain on a mobile device.
The Option Chain Explained
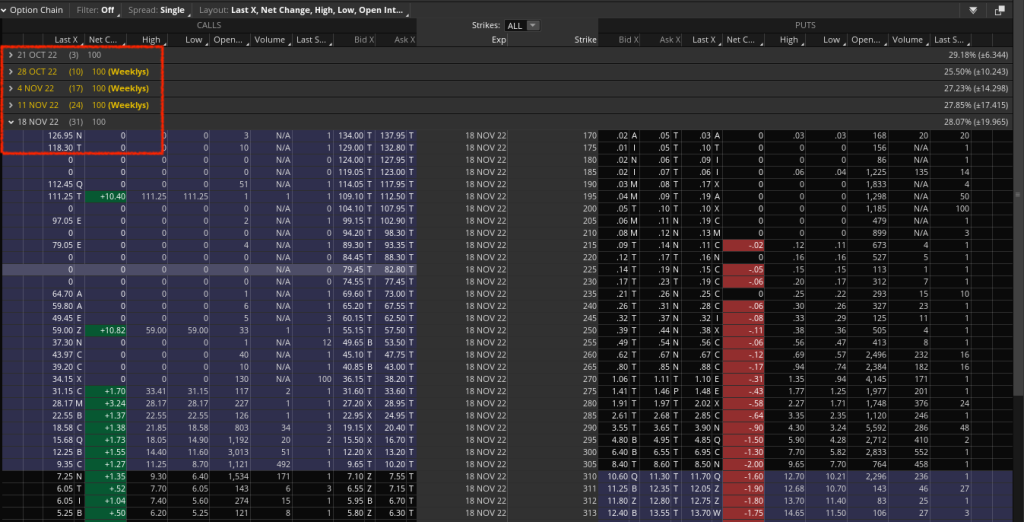
After you open the option chain, the first thing you are going to see is options series and expiration dates. These are the expiration months and they can go out to 3 years. If you click on this, it will open up and show you all the available strikes within that expiration month.

The Basic Info On The TD Ameritrade Options Chain

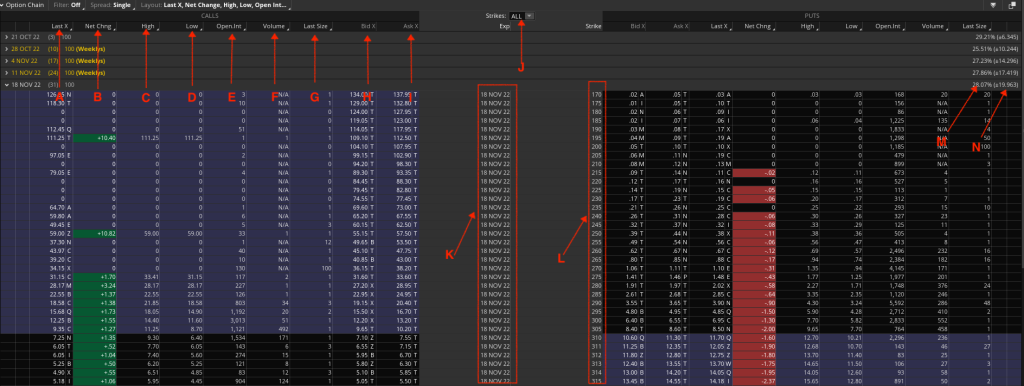
A– This is the last price (link to knowledge base article) that the Option contract was traded at
B– This is the dollar amount that the contract has increased or decreased by during the trading session
C– This is the highest price at which the contract has traded during the session
D– This is the lowest price at which the contract has traded during the session
E– This is the Open Interest (link again) and it represents the total number of contracts being held
F– This is the Volume- this is the total number of contracts that have traded
G– Last Size- this is the number of contracts that was last traded
H– Bid- this is the price that traders are willing to pay for the contract (link again)
I– Ask- this is the price that traders are asking for the contract
J– This is the “Strikes” drop down menu and when you click on it, it will show you all the available strikes for that Option expiration month that you are looking at or whatever number you want.
K– This is the expiration month and day.
L– These are all the available strikes
M– This is the Implied Volatility (link)
N– This is known as the “expected move” it tells you how much the stock should move up or down based on the Implied Volatility
The Greeks & Options Specifications

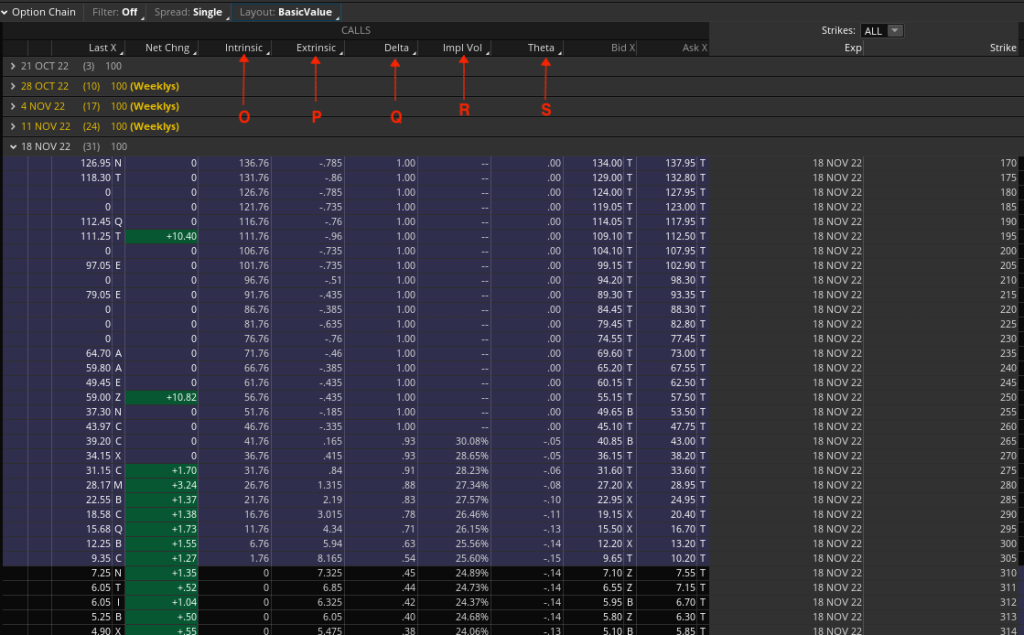
O– This is the Intrinsic value and it tells you what % of the option premium is “in the money”
P– This is the Extrinsic Value and tells you what % of the option premium is “out of the money”
Q– This is the Delta (link again) and it tells you how much the option premium should move relative to the underlying stock.
R– This is the Implied Volatility and it tells you ….(link)
S– This the Theta and it is a measure of time decay. It tells you how much the Option contract will decrease by, with each passing day that it is out of the money.
If you need to dig further into Unusual Options Trading or just Options Trading in general, you can check out the knowledge base.


